Top 10 Tools that can help You Visualize Your Infographic Data
A number of updated and latest technologies are now available with the advancement of communication and technology which help to gather data and information and examine them. The data visualization services have become quite popular these days. This allows the users to represent their data in a pleasing comprehensible form instead of regular monotonous excel sheet. With the help of data visualization tool data can be presented in a more presentable way. Data visualization is in many ways similar to information visualization, information graphics, statistical graphics and scientific visualization. It displays a different sets of complex data in easier and interactive manner. There are a number of tools which can be helpful for online data visualization. You can find many of these tools online.
Following are some of those tools which can be available online and can be helpful for the web developers and web designers.
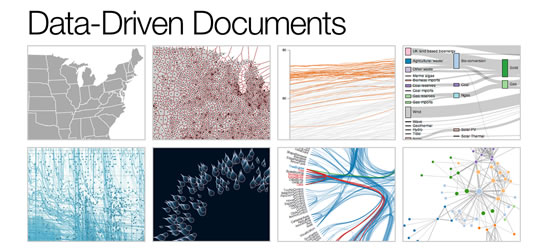
1. D3.js
D3.js is a JavaScript library helping in document manipulation with the help of CSS, HTML and SVG on the basis of the data. This tools helps to solve any problem from its root unlike monolithic framework which tend to offer each conceivable feature. It also offers effective manipulation of the documents on the basis of the data. This helps us to stay away from the proprietary representation and comes up with super flexibility utilizing the full support of web standards like SVG, HTML5 and CSS5.
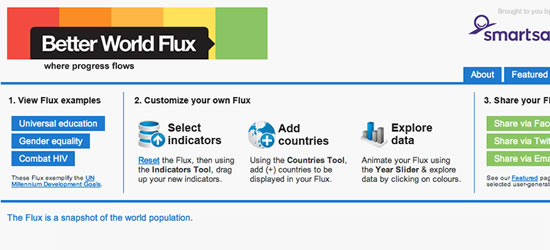
2. Better World Flux
It is one of the nicest data visualization tools available which is an interactive tool which conveys the necessary ideas and information to the world. First you need to select the country you reside and the choose the indicators like access to water or life expectancy.
3. Visual.ly
This online data visualization tool is probably the most popular tool among its users. This tool has been developed keeping in mind the features related to social networking services which help to connect people all over the world. This tool allows the users specially the designers and developers to submit their projects related to infographics and online data visualization into the site gallery of their own. This gallery can be divided further into a number of categories such as technology, designing, foods and many more.
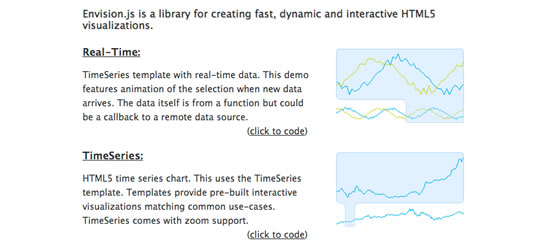
4. Envision.js
Envision.js can help you to develop an effective and interactive HTML 5 online data visualization. This tools has been refurbished on the basis of HumbleFinance which is a library of HTML 5 canvas finance visualization. This tool comes with a number of features like mobile phone support, modern browser, API used in custom visualization, HTML 5 chart etc.
5. Google Chart Tools
This tool has been developed by Google to help the users in designing Pie Charts, Scatter Charts, Tables etc. The maps here can be customized easily and are compatible with a number of browsers and platforms like Android and iOS. This tool have got huge user acceptance because of its user friendliness.
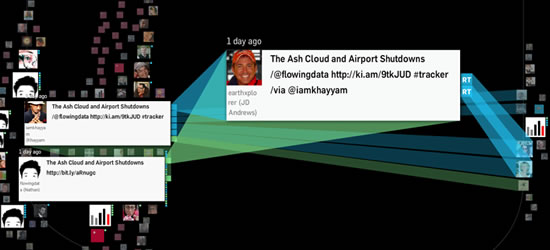
6. Revisit
Revisit online data visualization tool allows you to check the way Twitter appears to us. This tool allows the users to develop custom line maps of the data that connect the tweets which are related to one or multiple keywords.
7. HTML Graph
Though you may find it surprising but it is true that the HTML graph works exactly in the same manner as it claims in the advertisement. If you enter the URL in the home page and then press enter it will generate a node graph. The entire application is built on java that helps to check the structure of HTML on the webpage.
8. Leaflet
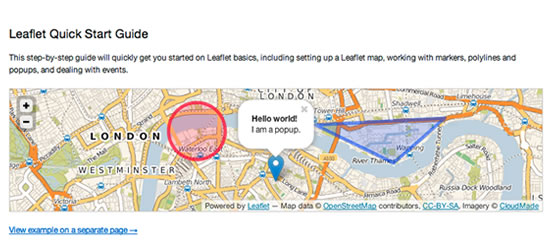
This is an open source Java script which helps in developing mobile phone friendly and communicative maps. Though the application is quite small in size still it has lots of features inbuilt with it. It can work smoothly on both PC and mobile and platforms such as Android and iOS.
9. Sigma.js
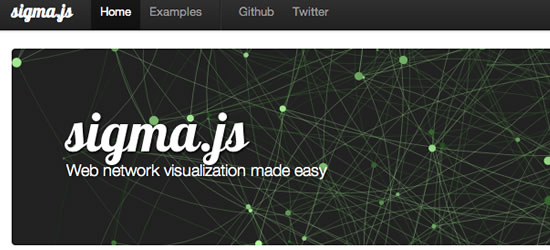
Sigma is also a java script library which utilizes HTML canvas elements in order to develop graphs. This tool does not require much coding and it has simplest and easy to use public API.
10. Newsmap
This tool helps to check the updated news across the world. A Japanese developer developed this tool to collect all the latest articles from the Google News.

